Low-income wage gains are an illusion—blame the rent

Over the last year, many people have been grappling with the question of whether the economy sucks. Or, anyway, whether the economy was in good or bad shape before Trump hit it with a wrecking ball. This remains a question of enormous political importance. After we make it out of (gestures wildly) all this, is 2024 the north star to lead us back to the good times?
In this post I will explain that the 2024 economy was very bad indeed. It had nothing to do with Biden. It was the result of decades of rising unaffordability. At the center of that unaffordability was housing.
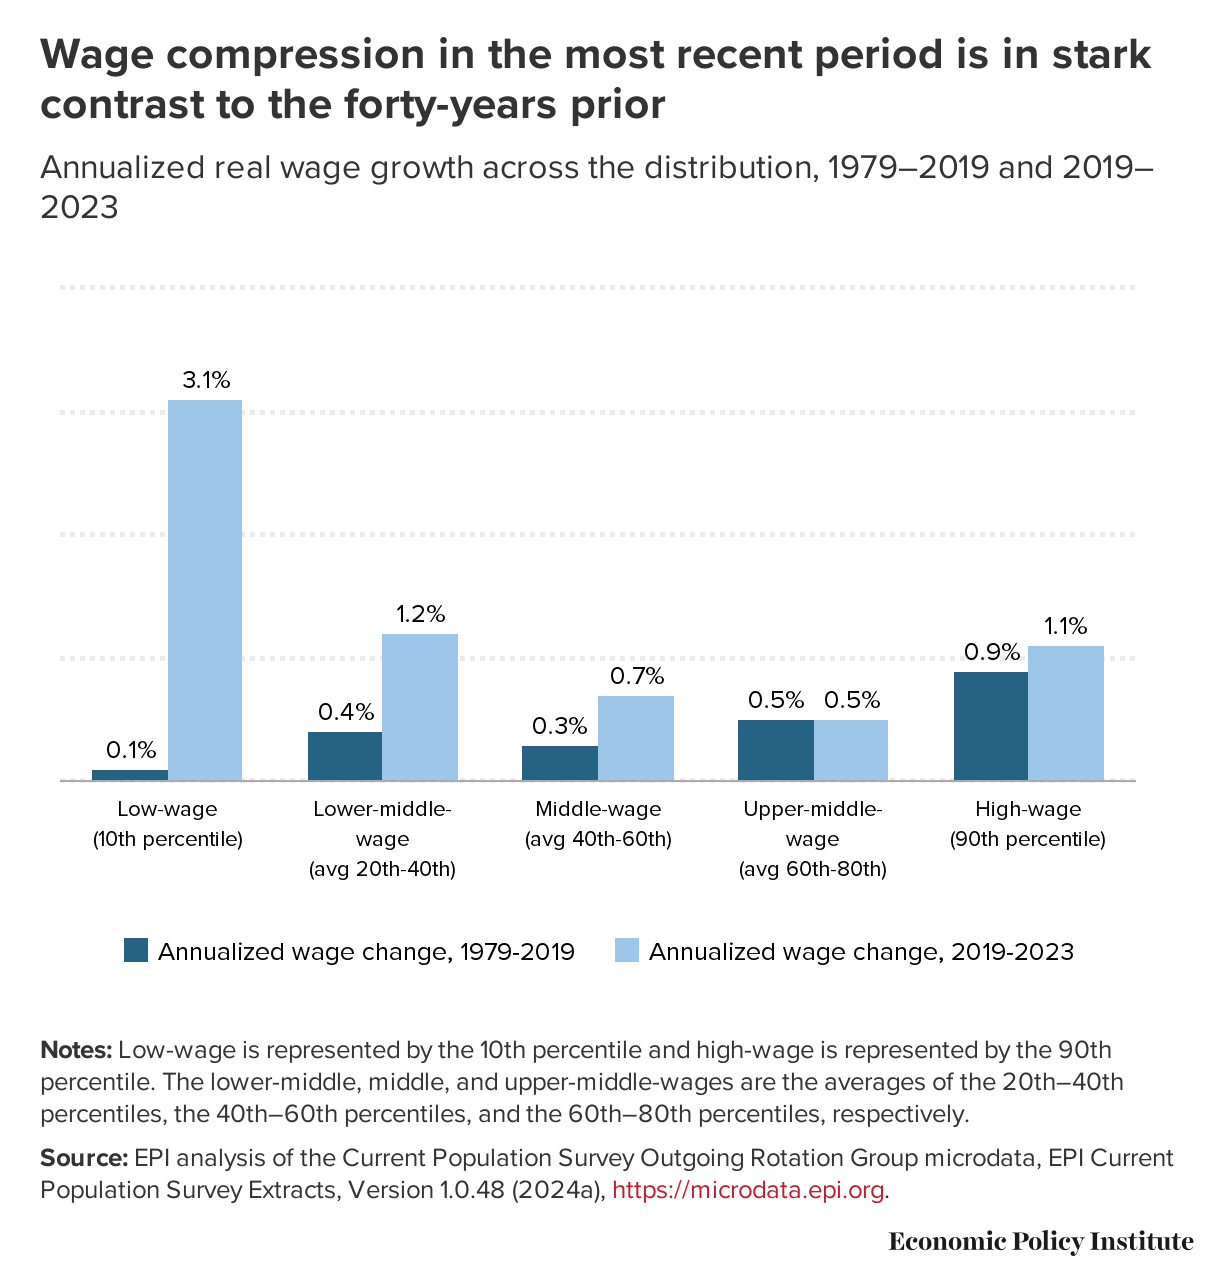
With respect to the previous few years, the 2024 economy was gravy. As liberal pundits emphasized repeatedly, the unemployment rate was at a 40-year low. S&P 500 at an all-time high. The CHIPS act caused factory construction to quadruple. Most remarkably, the pandemic recovery was the first time in decades that low-wage workers saw their earnings increase faster than high-wage workers. The vast American earnings inequality gap had finally narrowed slightly.
Looking at numbers like these, it's hard to imagine what people could have been upset about. Most economists at this point simply believe voters were misled about the state of the economy. There was a "vibecession." The evidence for the vibecession is admittedly quite good—here are results from two iterations of the Michigan Consumer Survey, as analyzed by Paul Krugman:
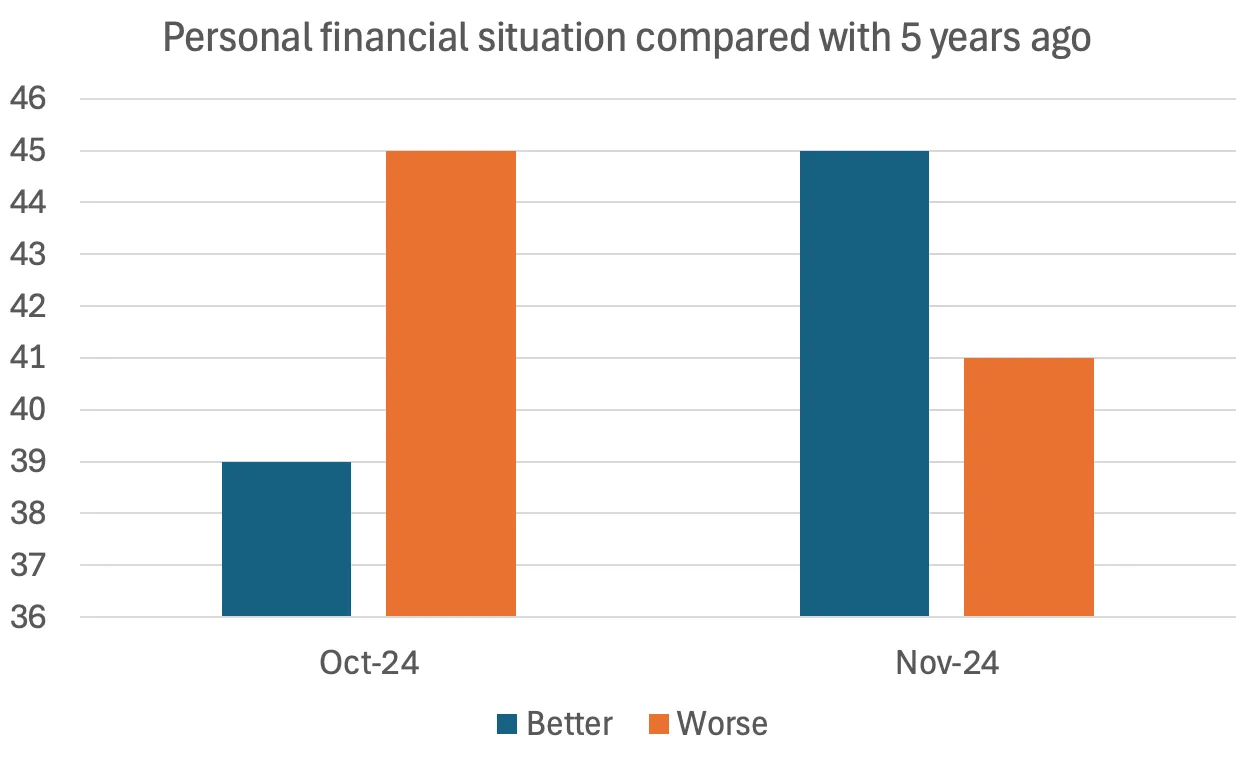
As Krugman points out, it is highly unlikely that a huge number of people had a sudden improvement in their financial situation right around the election. There was a vibe change.
A recent Politico article from the Ludwig Institute fought back, arguing that the economic situation is actually very bad once you take precarious employment into account. They publish estimates of this expanded measure of unemployment on their website—including a graph that, unfortunately for their argument, shows their measure of unemployment also reaching its lowest point in 2024. So much for that approach.
It's the Housing
Here is another graph from EPI, showing real wage growth over time. This is the framework in which most economists think about the progress of workers' well-being. "Real" wages are wages adjusted for inflation, generally the Consumer Price Index (CPI). The CPI adjusts dollar values based on how much goods and services the dollar can buy—including housing.
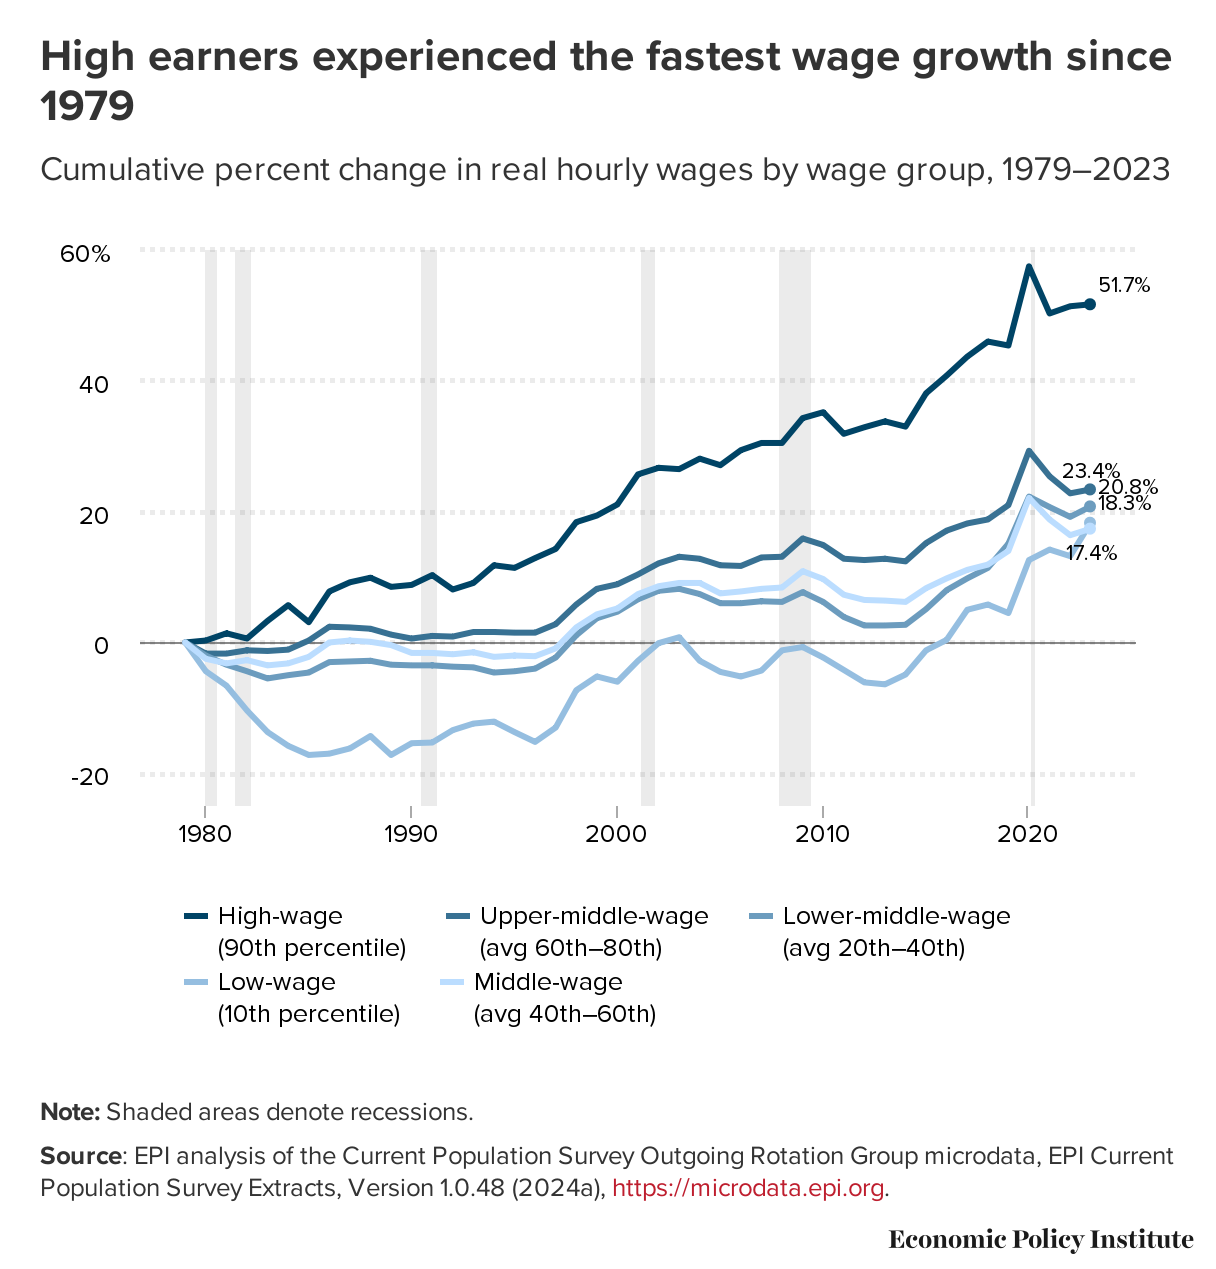
Wages for the top 10% earners have grown about 2.8 times faster than wages for everyone else. But if we put our concern for inequity aside for a moment, the story is still one of rising tides lifting all boats. Even the bottom 10% of wage earners are better off than they were in 1979, and the same could not be said for most years between 1979 and 2014.
This is the story as far as the CPI is concerned. CPI tells us about how much money it takes to buy a "standard basket" of goods and services. This standard basket includes housing, groceries, clothes, medical services, and plenty else. As of December 2024, "shelter" constituted 35.5% of the basket (shelter is housing less utilities, furnishings, and operations). The shares of things in the basket make sense for the middle percentiles of the income distribution. But the further out toward the extremes of the income distribution they become less accurate with respect to what people actually spend their money on.
The shelter component of CPI is weighted between the rent that renters pay and "owners' equivalent rent," which accounts for rising house prices. For simplicity, I'm just going to focus on renters. In order to compare wages (which are earned by individuals) to rent (which is paid by households), I'm going to use household wages, or the sum of all wages earned in the household, and include only households with 90% of household income coming from wages.
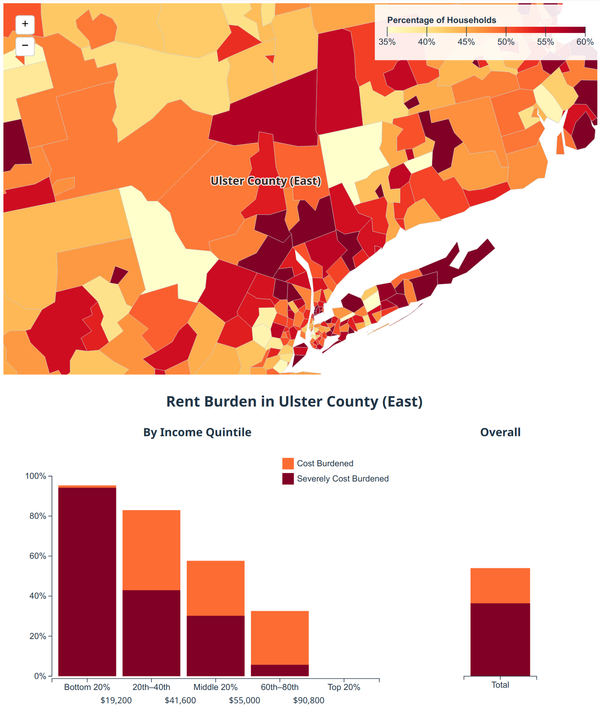
The graph below shows the average amount of household wages spent on rent at each renter income level. Since CPI shelter importance also includes owners, it's not a perfect comparison, but it does accurately convey the problem. It should be noted that the graph showing rental expense across household incomes looks almost identical. All this data is from 2023.
From this graph it is clear that CPI-adjusted wages do not adequately capture the importance of housing expense for the bottom, say, 30% of wage-earning renter household incomes. It is exactly right only at the 40th percentile, which is $50,200 (note that these numbers are higher than for renter households overall, since many of the lowest-income households do not earn wages). If the real wage is supposed to measure a worker's ability to buy things, it significantly overestimates the ability of low-wage workers to buy things that aren't a place to sleep.
The fact is that the rent eats first, and housing is most people's largest expense. If we want to get a good sense of how people's purchasing power has changed over time, it makes sense to try to capture this expense accurately.
One way to do that is to look at real household wage growth after rent. The general idea is to subtract rent from household wages and adjust by a measure of inflation that excludes shelter.
The technical details require a little bit more creativity. Among households earnings at least 90% of income in wages, some households are single-earner (about 54% of them), some are dual-earner (37%) and some have more than two earners. It's not fair to put a three-earner household making a total of $60,000 into the same bucket as a single-earner making $60,000. For this reason, I bucket households into wage quintiles separately according to how many wage earners are present. I then calculate after-rent wage growth for each quintile as the average across the earner groups.
First, so that we can do an apples-to-apples comparison, let's look at real household wages over time, just using CPI the old-fashioned way. We're not treating rent specially yet.
This lines up pretty well with the story told by real hourly wages, as shown in the EPI chart. Household wages exhibit a bit more inequality than hourly wages. This makes sense—there is less inequality between a barista and a doctor than between a single-earner barista household and a household with two doctors in it.
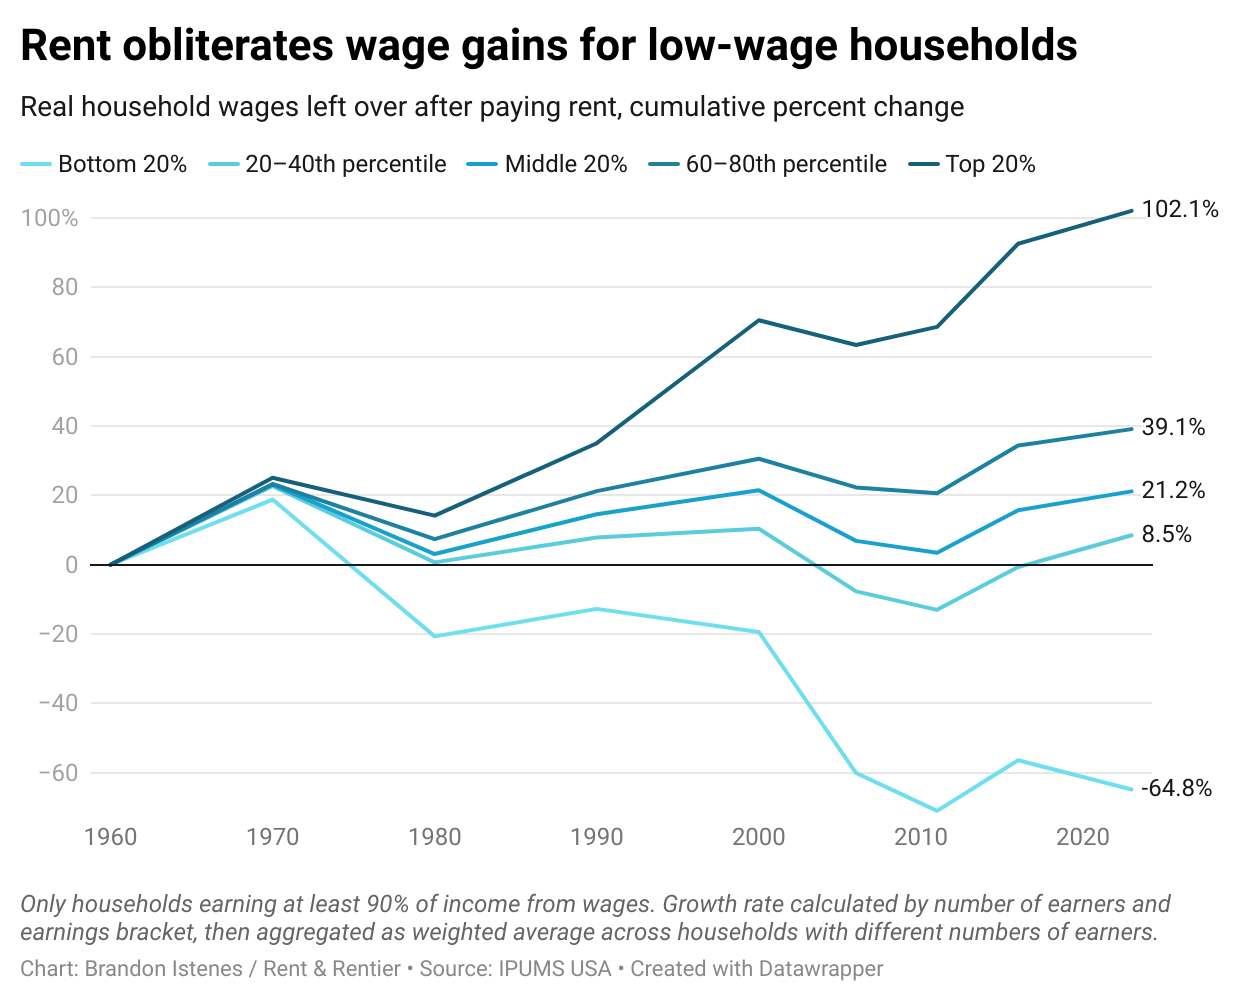
This difference is nothing compared to what we see when we account for rent appropriately. Here is the result, with rent deducted from household wages.
It is immediately apparent that inequality is dramatically wider when we take rent into account. The bottom fifth of wage-earning households have seen their ability to pay for anything other than rent decrease by 65% since 1960. That's one in five households absolutely crushed by rent over decades.
It's a large share of Americans who have seen their fortunes decline over the long run. 40% of renters have less purchasing power left over after paying rent than they did in 1970. Low-middle wage earners (20th—40th percentile) have seen only 8.5% after-rent wage gains since 1960, or 8% since 1980. Meanwhile, the top 20% of renter households have seen their after-rent purchasing power double in that time.
When you hear economists say that CPI takes rent inflation into account, remember that rent costs are highly unequally distributed, and compound the poverty of the poor. The rent eats first, and poor households are left with less and less on the table.
What does this tell us about the political future of the economy? For the poorest 40% of wage-earning renters, the last 50 years of economic development has very little to show. For the poorest 20%, this period has been a disaster. And that's not even taking into account those dependent on social security or other non-wage income. It's not just vibes. The populist sentiment that the economy has been hard on people is empirically sound.
The way out is forward. I don't know what the economy will look like 10 years from now. But the reconstruction of a politically stable society will require something vastly more equitable than we saw during the neoliberal period. And this will require that we solve the housing question.